California Water 101
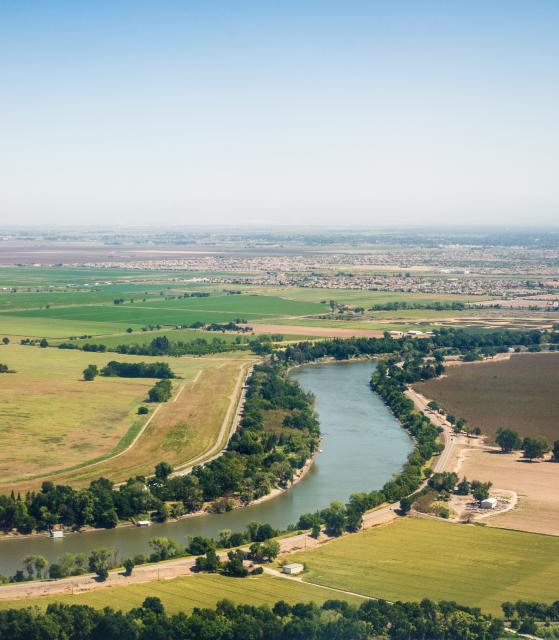 California has been called the most
hydrologically altered landmass on the planet, and it is true.
Today the state bears little resemblance to its former self.
Where deserts and grasslands once prevailed, now reservoirs store
water to move it to the arid land. Swampy marshes have given way
to landfill for urban development. Wetlands have been converted to
farmland. California’s water resources now support 35 million
people and irrigate more than 5.68 million acres of farmland.
As a result of the development of the state’s natural resources, especially water, California has emerged as a leading agricultural producer, a major manufacturing center, the most populated state in the country and the eighth largest economy in the world.
However, this intensive development has not been without its consequences. Fish populations have been depleted. Wetlands have been drained. Dams and levees have altered natural water flow patterns. Invasive plants and species are changing ecosystems and altering native habitat. Species of many native plants and wildlife have declined or become extinct, and water quality has been impaired by agriculture, ranching, mining and urban sources.
Much of California has a “Mediterranean” climate, characterized by warm, dry summers and mild winters. Most of the precipitation falls in the winter as rain and snow. Although the climate is variable, the state receives about 200 million acre-feet of precipitation per year on average. An acre-foot of water equals about 326,000 gallons, or enough water to cover an acre of land (the size of a football field) 1 foot deep. One acre-foot is enough water to meet the annual indoor and outdoor needs of two households.
About 60 percent of all precipitation evaporates or is transpired by trees and vegetation. What’s left is roughly 75 million acre-feet per average year that flows into waterways and groundwater aquifers and ultimately becomes available to use in homes, as irrigation for farmland, by industry and in the environment.
There’s a catch. While parts of Northern California receive 100 inches or more of precipitation per year, the state’s southern, drier areas receive less precipitation – and just a few inches of rain annually in the desert regions. That means 75 percent of California’s available water is in the northern third of the state (north of Sacramento), while 80 percent of the urban and agricultural water demands are in the southern two-thirds of the state.
Despite the geographic and hydrologic challenges, California has more irrigated acreage than any other state, thanks to massive water projects that include dams, reservoirs, aqueducts and canals to deliver water to users, especially in the central and southern portions of the state. Water also is moved east to west such as through San Francisco’s Hetch Hetchy system.
Water Projects and the California Economy
 Water fuels the economy of California, and managing
it properly is of paramount importance.
The resource also has been a source of decades-long political wars. Besides satisfying the needs of a growing population, demands for more water also come from the agricultural industry, businesses, manufacturers and developers. These needs must be balanced against demands for protecting water quality and for protecting fisheries, wildlife and recreational interests.
The fundamental controversy is one of distribution, as conflicts between these competing interests continue to be exacerbated by continued population growth and periods of drought.
Everything depends on the development and management of water:
Capturing it behind dams, storing it in reservoirs, and rerouting
it in canals stretching hundreds of miles across the state.
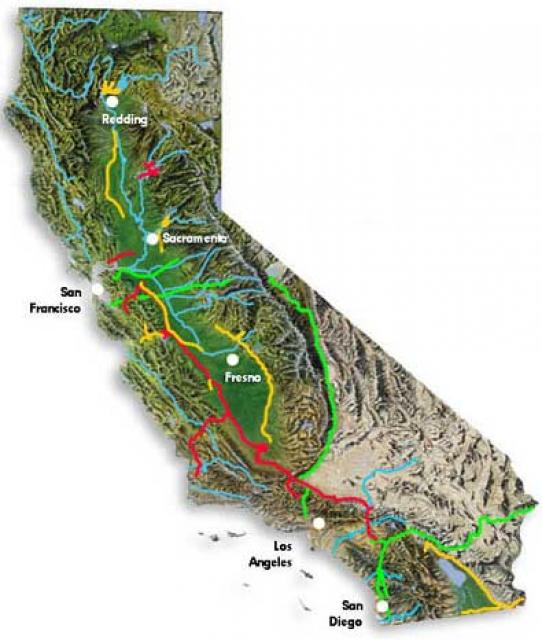
California has 1,400 dams, two of the largest water storage and
transport systems in the world – the Central Valley Project
(CVP) and State Water
Project (SWP) – and some of the largest reservoirs in the
country. 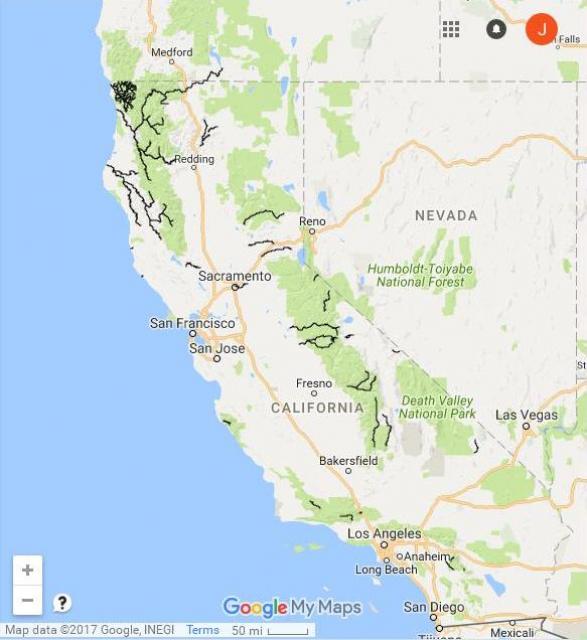
Click here to see an interactive map of the state Wild & Scenic rivers in California
Yet, leaving water in rivers and streams is important for the health of the environment, wildlife, and fish. Some water is officially dedicated to the environment, such as Bay-Delta outflows. Other waterways are protected under the state and/or federal Wild and Scenic Rivers Acts, putting further water development off-limits. Overall, how much water is left in streams and rivers for the environment depends on a lot on yearly precipitation. Drought years, such as 2014, left many streams depleted and cities and farmers facing water supply cutbacks and, in some places, water rationing.
About 62 percent of California’s water goes to agriculture, 16 percent to urban use and 22 percent is dedicated to instream flows and to maintain drinking water quality, according to the California Water Blog and former University of California, Davis professor Jeff Mount, based on net water use, which accounts for water that is lost to evapotranspiration or salt sinks and not returned to rivers or groundwater.
California’s Water Supply
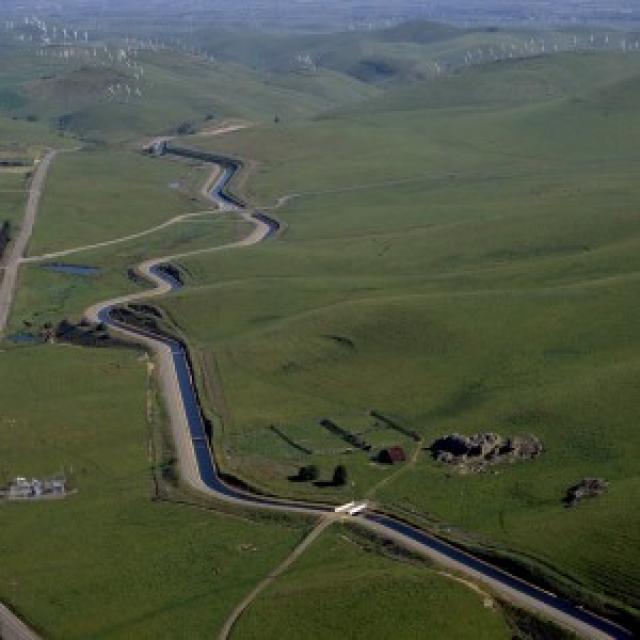 California depends on two sources for its
water: surface water and groundwater. The water that runs into
rivers, lakes and reservoirs is called “surface water.”
Groundwater is found beneath the earth’s surface in the pores and
spaces between rocks and soil. These are called aquifers.
Most of California’s precipitation falls as snow in the northern part of the state during the winter. The snow acts as a natural reservoir, storing water until the spring runoff. After initial evaporation, percolation into the ground and transpiration, the water flows into streams and rivers and makes its way toward the ocean or into salt sinks.
The water collected in the state’s reservoirs is called the
“developed supply,” and it is this amount that is available to
deliver for urban and agricultural uses, to keep in reservoirs,
put into groundwater storage or to dedicate to the environment.
There is great competition for the limited amount of developed
water supply, and human consumptive uses are the top priority for
developed water supply in California under existing
law.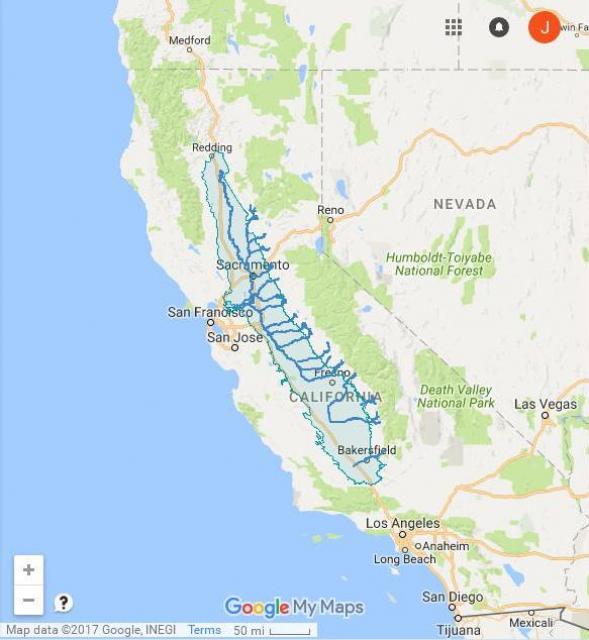
Click here to see an interactive map of the hydrology of the Central Valley
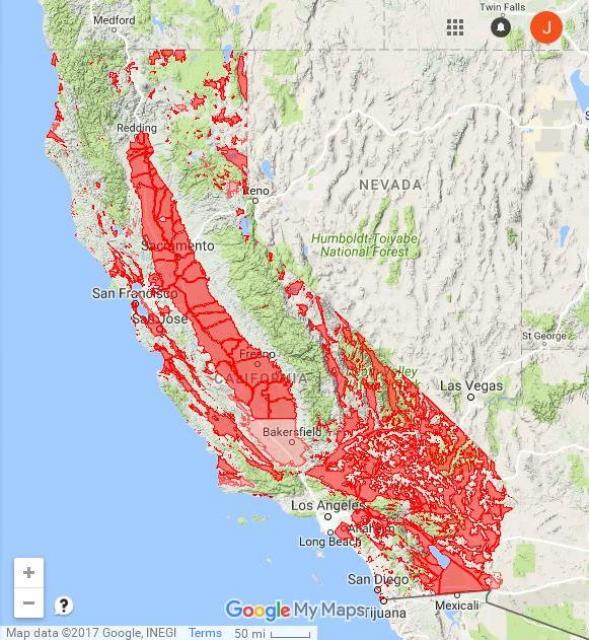
California has 10 major drainage basins, also known as the state’s hydrologic regions. From north to south the basins are: North Coast, Sacramento River, North Lahontan, San Francisco Bay, San Joaquin River, Central Coast, Tulare Lake, South Lahontan, South Coast and Colorado River.
Amazingly, with the hundreds of rivers and streams plus more than 1,500 lakes and reservoirs in California, the state’s groundwater storage capacity is more than 10 times that of all its surface waterways.
Water pumped from wells in a typical year quenches 40 percent of California’s freshwater needs, according to the State Water Plan update, published by the California Department of Water Resources (DWR) every four years. That number increases to 60 percent or more in dry years. In any year, groundwater use varies by region; some areas of California are much more dependent on groundwater than others.
Many rural areas depend entirely on groundwater, as do larger cities, such as Bakersfield and Fresno. Along the Central Coast, 90 percent of all drinking water is from groundwater. However, other cities, such as San Francisco and San Diego, have very little groundwater resources. In all, 85 percent of Californians depend on groundwater for at least part of their drinking water, according to the California State Water Resources Control Board (State Water Board).
California uses more groundwater than any other state. And when reservoirs run low, farmers and cities pump even more water from underground. While there are programs throughout the state to recharge groundwater basins, in many parts of the state, no efforts are made to put water back into the ground. Overall, California pumps out up to 2 million more acre-feet a year than is recharged, according to state estimates.
Surface water and groundwater are connected in a system of watersheds and groundwater basins. The State Water Plan notes surface water and groundwater are a single resource, “In California, winter precipitation and spring snowmelt are captured in surface water reservoirs to provide both flood protection and water supply to the state. Reservoir storage also factors into drought assessment. The state’s largest surface ‘reservoir’ is the Sierra Nevada snowpack, about 15 million acre-feet on average,” the State Water Plan states.
New Groundwater Rules
Click here to see an interactive map of groundwater basins and sub-basins
California’s groundwater has gone unregulated at the state level for decades. In fact the state was one of the last to enact any laws pertaining to how this resource can be pumped and used. However, a new era of groundwater management began Sept. 17, 2014 after Gov. Jerry Brown’s signing of historic legislation, the Sustainable Groundwater Management Act (SGMA), which empowers local officials to halt the trend of critically overdraft basins.
The law, which went into effect in 2015, sets a timeline to identify responsible local agencies – which will work as a team – the means to reverse overdrafted conditions in certain areas and to ensure the 127 “high and medium priority” groundwater basins or sub-basins not in overdraft reach sustainability by 2040.
Whether SGMA will realize its full transformative potential remains to be seen.
Read more about groundwater in Aquapedia, the Foundation’s online water encyclopedia.
California’s Vast Infrastructure – The State Water Project and Central Valley Project
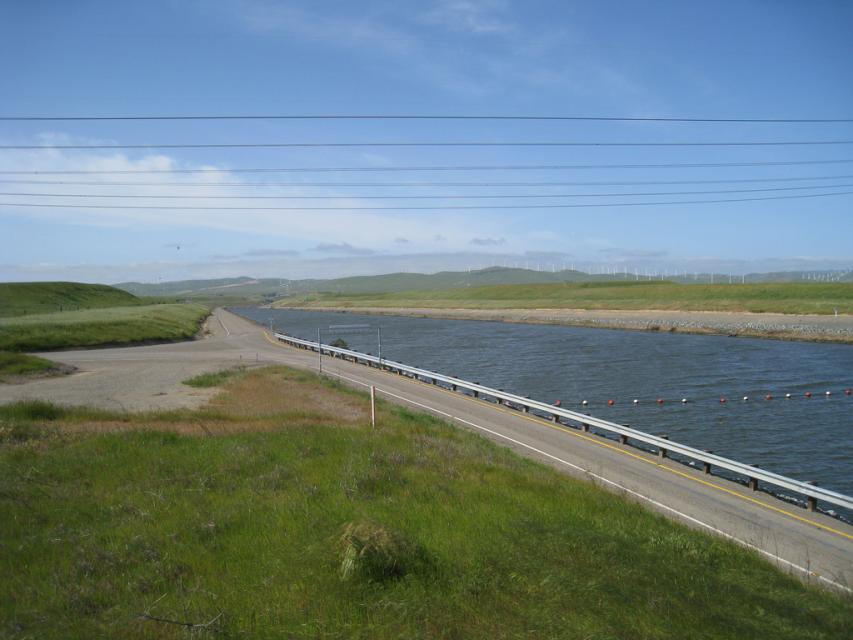 California’s major urban centers, Southern California
and the Bay Area, lack sufficient groundwater and other local
resources to support their large populations so water must be
imported from other portions of the state. The San Francisco Bay
Area imports more than 65 percent of its water through the Hetch
Hetchy Aqueduct, the East Bay’s Mokelumne Aqueduct. The region
also obtains water from the SWP and the federal CVP.
Contra Costa County obtains its supplies directly from the Delta. In addition to Hetch Hetchy, the SWP’s South Bay Aqueduct supplies water to Alameda and Santa Clara counties. Groundwater is another major source of supply for the Santa Clara area, which also receives water from both projects.
Southern California imports more than half of its water supply through the Los Angeles Aqueduct, the Colorado River Aqueduct and the SWP.
One of the state’s earliest major water projects, the Los Angeles Aqueduct, supplies water and electricity to 3.8 million residents in the city of Los Angeles.
Serving as a wholesale entity for most of the southern California region, the Metropolitan Water District of Southern California imports water from the Colorado River and the SWP and supplies it to member agencies and cities. Many Southern California cities also rely on groundwater, especially those along the coast.
California’s vast agricultural industry also depends on large water projects. The CVP supplies water primarily for irrigation within the Central Valley, and Kern County relies on the SWP for its water. The Imperial Irrigation District manages the system which delivers Colorado River water to the Imperial Valley.
Los Angeles Aqueduct: Owned and operated by the Los Angeles Department of Water and Power, the Los Angeles Aqueduct supplies a portion of the water needed to supply the residents and businesses in its 465 square mile service area. The Los Angeles Aqueduct system brings water 338 miles from the Mono Basin and 233 miles from the Owens Valley by gravity to Los Angeles.
Hetch Hetchy Aqueduct: The Hetch Hetchy water system delivers about 265,000 acre-feet of pristine Sierra Nevada water per year to 2.4 million people in San Francisco, Santa Clara, Alameda and San Mateo counties. Eighty-five percent of the water comes from Sierra Nevada snowmelt stored in the Hetch Hetchy reservoir situated on the Tuolumne River in Yosemite National Park. Hetch Hetchy water travels 160 miles via gravity from Yosemite to the San Francisco Bay Area.
Mokelumne Aqueduct: The East Bay Municipal Utility District draws water from the Mokelumne River and transports it 91 miles from the Sierra Nevada through three steel pipeline aqueducts to serve its customers in the East Bay Area. The Mokelumne Aqueduct provides 90 percent of the water served by East Bay Municipal Utilities District.
Colorado River: Spanning 1,440 miles from Wyoming to the Gulf of California, the Colorado River is the principal water resource for California and six other states, Indian tribes and parts of Mexico. The Colorado River supplies urban areas through the Metropolitan Water District of Southern California, the region’s water wholesaler. Farmers in the Imperial, Palo Verde and Coachella valleys also rely on the Colorado River.
Central Valley Project (CVP): As California’s largest water supplier, the CVP delivers on average over 7 million acre-feet of water per year. CVP water is used to irrigate 3 million acres of farmland in the San Joaquin Valley, as well as provide water for urban use in Contra Costa, Santa Clara, and Sacramento counties.
The State Water Project (SWP): The largest state-built water and power project in the United States, the SWP spans 600 miles from Northern California to Southern California, providing drinking water for 23 million people and irrigation water for 750,000 acres of farmland.
Where does your water come from?
The answer depends upon where you live. Some areas have abundant local sources while other areas rely on imported water for most or even all of their water. When you turn on a faucet to draw a glass of water, you may be tapping a source close to home or one hundreds of miles away. Find out where your water comes from by clicking here.
The Importance of Agriculture
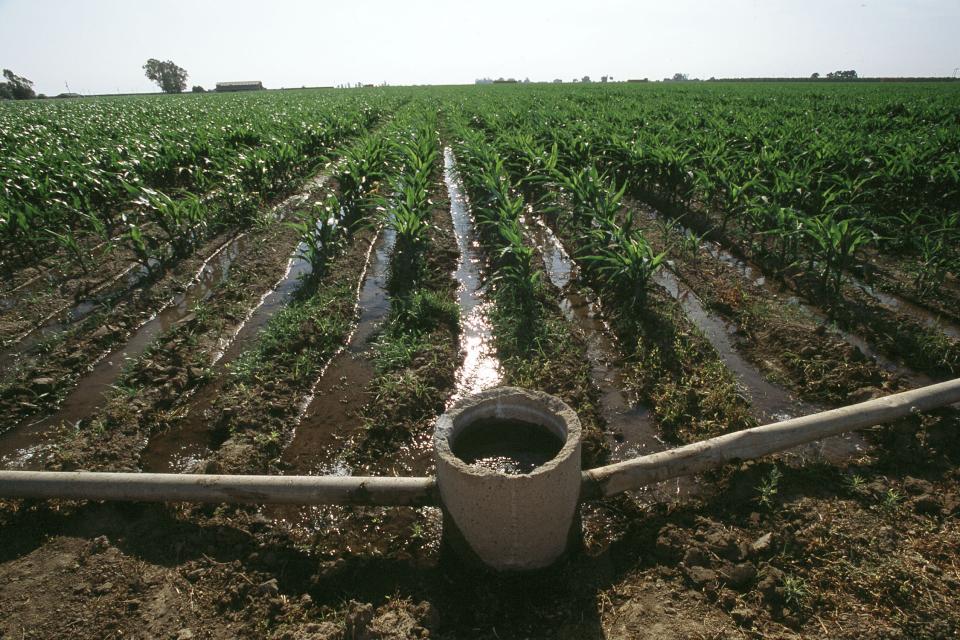 California has been the nation’s leading
agricultural and dairy state for more than 50 years. The state’s
80,500 farms and ranches produce more than 350 agricultural
products. These products generated a $50 billion in sales
value in 2019. More than a third of the country’s vegetables and
two-thirds of the country’s fruits and nuts are grown in
California.
The state’s Top 10 agricultural products are: milk ($7.34 billion), almonds ($6.09 billion), grapes ($5.41 billion), cattle and calves ($3.06 billion), strawberries ($2.22 billion), pistachios ($1.94 billion), lettuce ($1.82 billion), walnuts ($1.29 billion), floriculture ($1.22 billion) and tomatoes ($1.17 billion), according to 2019 California Department of Food and Agriculture (CDFA) statistics.
Besides California touting the largest agricultural economy in
the nation, nine of the nation’s top 10 agricultural counties are
within state boundaries. Fresno County is the most
productive agricultural county in the nation, producing more than
350 crops worth a total value of more than $7.7 billion.
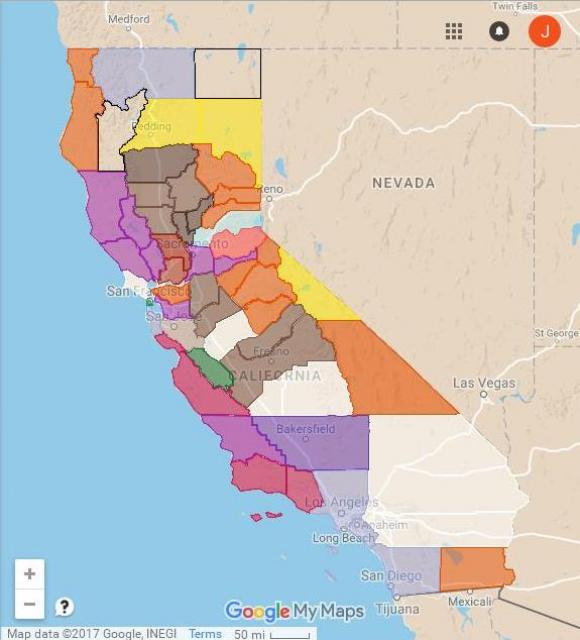
Click here to see an interactive map of the leading agricultural commodities in California by county
California also continues to be the top exporter of agricultural products in the United States, according to the USDA’s Economic Research Service. The state exports the greatest amount and range of vegetables, fruits, and nuts.
“The Agricultural sector is one of the largest industry sectors in California, and its performance is vital to the economic health of the state,” notes the California Employment Development Department (EDD).
California farms employ between 500,000 to 800,000 workers each year. That’s about one-third of the country’s total workforce of farmworkers.
Reports indicate about 77 percent of the workers are male. More than half are between the ages of 25 and 44; 18 percent are under the age of 25 and 26 percent are between the ages of 45 and 64. The vast majority, 92 percent, of farmworkers in California are Latino. and about 75 percent of California’s farmworkers are undocumented.
Read more about farmworkers here from the California State Library and here.
See where California farmworkers work on this map by EDD.
Despite its economic importance, the agricultural industry has lost an average of 30,000 acres annually to nonagricultural uses during the past 30 years, according to California Climate and Agricultural Network. The availability of water is crucial to the success of the state’s agriculture industry, especially because California is semi-arid, in general, and much of the agricultural cropland is in areas where surface water must be pumped and groundwater has been historically depleted. But some of that loss also is attributed to urban growth as cities annex outlying farmlands for commercial/industrial and residential developments.
The challenge is providing agriculture an adequate supply given the competition from urban users and providing for environmental needs, and also the complications and reduced availability due to seasonal droughts and climate change.
Today’s farmers have become adept at water use efficiency. As a result, they produce nearly twice as much food as they did four decades ago with only 10 percent more water, according to the CDFA.
California’s Top 10 Agriculture Counties:
- Fresno – almonds, pistachios, livestock, grapes ($7.7 billion total value)
- Kern – almonds, grapes, pistachios, milk ($7.7 billion total value)
- Tulare – milk, oranges, grapes, cattle ($7.5 billion total value)
- Monterey – strawberries, lettuce, broccoli, grapes ($4.4 billion total value)
- Stanislaus – almonds, milk, nursery, chickens ($3.5 billion total value)
- Merced – milk, almonds, cattle, chickens ($3.2 billion total value)
- San Joaquin – almonds, milk, grapes, walnuts ($2.6 billion total value)
- Kings – milk, almonds, cotton, pistachios ($2.2 billion total value)
- Imperial – cattle, hay, vegetables ($2 billion total value)
- Madera – almonds, milk, pistachios, grapes ($2 billion total value)
Source: Summary of California County Agricultural Commissioners’ Reports
For more information:
- California Farm Bureau Federation
- California Agricultural Resource Directory from the California Department of Food and Agriculture
- “Agricultural Conservation and Efficiency” whitepaper about agricultural water conservation from the California Department of Food and Agriculture
The Water and Energy Connection
Water and energy are interconnected. A frequent term to describe this relationship is the “water-energy nexus.”
Energy for Water
Conveying large quantities of water over long distances and over hills and mountains is energy-intensive. In addition, once it reaches its destination, more energy is needed to treat and pump water for residential, industrial and agricultural uses. Water distribution systems use energy for pumping and pressurization. Consumers and businesses use energy to treat water with softeners or filters. Energy is needed to heat and cool water, as well as to circulate it with pumps. In addition, treatment plants use energy to pump and treat wastewater and process solids.
Statewide, these processes consume 20 percent of the state’s total electricity, 30 percent of the state’s natural gas and 88 million gallons of diesel fuel, according to the California Energy Commission.
Water for Energy
Some of this energy can be recaptured by sending water down through turbines to generate hydroelectricity.
An average of 18 gallons of freshwater is needed to generate 1 kWh of electricity at hydroelectric plants, according to the National Renewable Energy Laboratory, a U.S. Department of Energy Laboratory in Colorado. Electric energy is typically measured in kilowatt-hours (kWh). A kilowatt is 1,000 watts. For example, a 60-watt light bulb that operates for 100 hours uses 6 kWh. In terms of the water and energy nexus, for example, wastewater treatment in California uses 500 to 1,500 kWh per acre-foot, according to the Environmental Protection Agency.
Thanks to energy generated at hydroelectric plants along their routes, the CVP, Hetch Hetchy Aqueduct and the Los Angeles Aqueduct are all net producers of energy, meaning they produce more energy that they consume to convey water.
However, the SWP and the Colorado River Aqueduct, the two main systems that bring water into Southern California, are net users of energy, meaning they use more energy than the amount generated by hydroelectric plants along their routes.
Pumping one acre-foot of Colorado River Aqueduct water to Southern California consumes 2,000 kWh. Yet, the SWP is the largest single user of energy in California. Pumping one acre-foot of SWP water to Southern California requires about 3,000 kWh. That’s an average of 5 billion kWh per year, the equivalent of about 2 to 3 percent of all electricity consumed in California.
The issue is this: the SWP pumps water 700 miles from the Sacramento–San Joaquin Delta to Southern California and two-thirds of California’s population (70 percent of SWP water goes to urban users and 30 percent to agriculture). This path includes up nearly 2,000 feet over the Tehachapi Mountains.
To put the amount of energy used to convey water into perspective, an average Californian household uses 573 kWh of electricity a month, according to the U.S. Energy Information Administration, and statewide per capita use of water is 196 gallons per day (gpd), according to DWR (about 892 gpd equals 1 acre-foot). So providing a Southern California household with the amount of SWP water it needs for 4.5 days takes the same amount of electricity that household uses during five months.
So what might be done to reduce the amount of energy used? One solution is water conservation by end users – residential, businesses, industrial and agricultural. By reducing the amount of water used, the demand lessens on the energy-intensive systems that deliver and treat water.
For more information:
- The Energy-Water Nexus, comprehensive website from Sandia National Labs
- Energy Down the Drain: The Hidden Costs of California’s Water Supply, report from the National Resources Defense Council
The Delta: The Hub and Critical Link of California’s Water System
The Sacramento-San Joaquin
Delta is California’s most crucial water and ecological
resource. Nearly two-thirds of the state’s population and
millions of acres of farmland receive their water from the region
where the Sacramento and San Joaquin rivers converge. [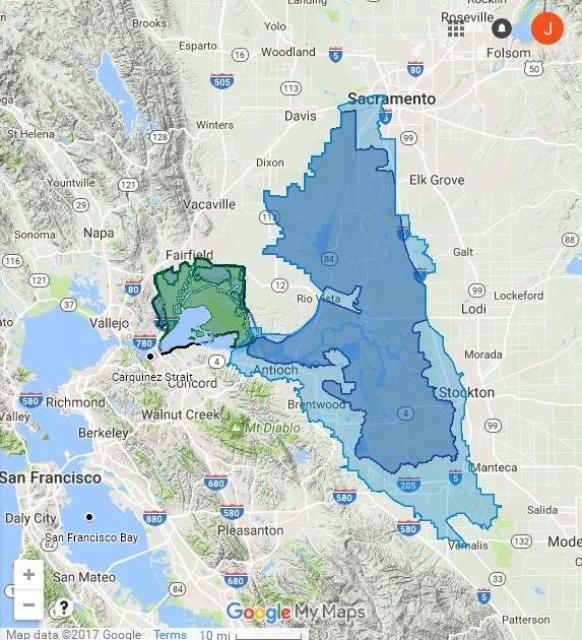 ]
]
Click here to see an interactive map of the Sacramento-San Joaquin Delta
The rivers’ combined fresh water flows roll through the Carquinez Strait, a narrow break in the Coast Range, and into San Francisco Bay’s northern arm, forming the San Francisco Bay/Sacramento-San Joaquin Delta Estuary, commonly referred to as the Bay-Delta. The mixture of fresh waters from the five rivers which feed into the Delta combine with the salty ocean water to create the largest estuary on the west coast of North America, covering more than 40 percent of California – more than 738,000 acres in five counties.
Most of the Delta – 500,000+ acres – is agricultural. The Delta
produces more than $500 million of agricultural products
annually. It was the first developed ag region in California,
thanks to flat land, fertile soil and ample water
supply.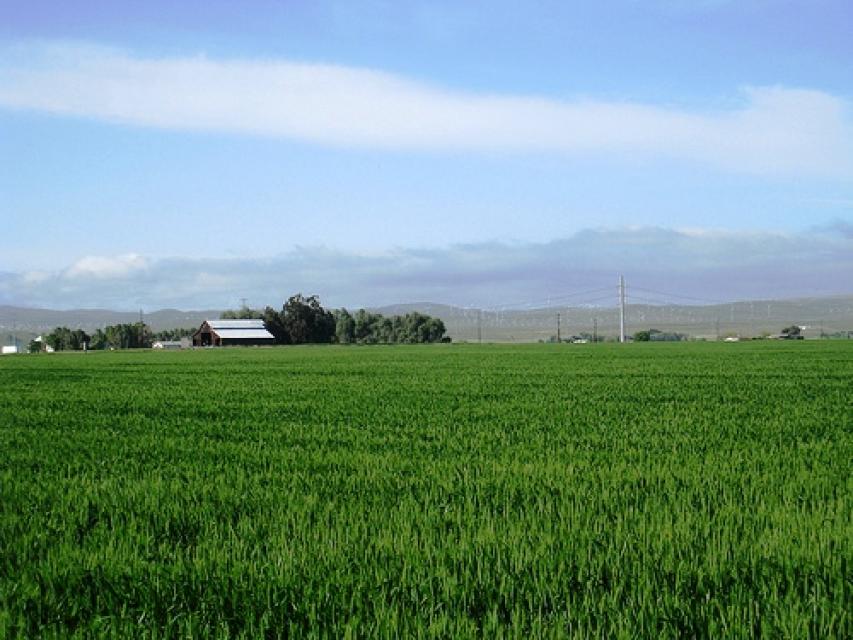
Early on, in the 1800s, key crops of pears and asparagus were transported from Sacramento to San Francisco via steamboats.
Today, hundreds of crops are grown in the Delta. The top 10 (2012 statistics) in acres:
- Corn for grain and forage (98,000 acres)
- Alfalfa (72,900)
- Wheat (43,100)
- Wine grape (32,800)
- Processing tomato (28,500)
- Safflower (11,800)
- Asparagus (8,500)
- Almond (8,300)
- Rice (6,900)
- Oat (5,700)
Most recently, the number of acres planted in wine grapes has increased to 85,000. While some Delta vineyards date back to the 1800s, newer vineyards thrive in the fertile soil. The Delta produces about 25 percent of the state’s wine grapes, which are exported to other regions and also used by local winemakers.
Chardonnay is the most widely planted variety with 19,806 reported acres. Zinfandel is a 2nd at 19,494 acres.
The Delta also is a significant estuary – a delicate environment where the fresh water from the inland rivers mixes with ocean water from the San Francisco Bay.
It’s the largest freshwater tidal estuary on the west coasts of North and South America. The diverse ecosystem supports 750 different species of plants, fish and animals. An estimated 80 percent of the state’s commercial fishery species live in or migrate through the Delta, and millions of migratory waterfowl rely on the region’s wetlands as they travel the Pacific Flyway from South America to Alaska.
The Delta also is a regional playground. With 290 shoreline recreation areas, 200 marinas with 12,000 in-water boat slips, 635 miles of boating waterways, and 61,000 acres of open water, the Delta draws nearly seven million visitors a year. Activities such as fishing, boating, waterskiing, wind surfing, sightseeing, birding, biking and camping generate about $1 billion annually in economic activity and support about 8,000 jobs, according to a state analysis.
The Delta is important. Everyone in California depends upon the Delta for something:
- Drinking water – the Delta provides a portion of the drinking water for 27 million Californians
- Fresh produce – 45% of fruits and vegetables grown in the U.S. are irrigated with Delta water
- Fish – 80% of the state’s commercial fish pass through the Delta
- Irrigation for agriculture – the Delta provides water for 4.5 million acres of the state’s $36-billion agricultural industry with irrigation
- Wildlife also depends on the Delta, as it provides crucial year-round habitat as well as an important stop for migratory birds.
However, the Delta is failing in health. Major issues include:
- Subsidence
- Fragile levee system
- Native species decline
- Potential earthquake risk
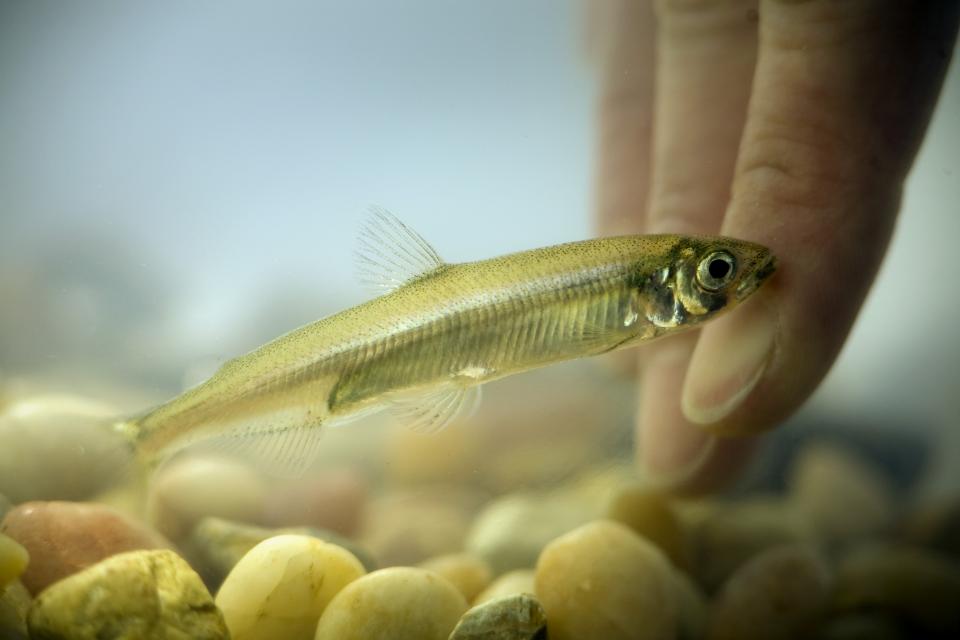 In recent years, populations of native fish species
in the Delta have plummeted. The population of the once-abundant
Delta smelt has seen a rapid
decline, and recent trawl surveys have found no smelt. The
Delta smelt is considered an indicator of the biological health
of the Delta, and its population has dropped so precipitously
that some scientists fear they are on the brink of extinction.
Other species, such as the chinook salmon, are threatened as
well.
Massive pumps at the southern end of the marsh pull about 5.5 million acre-feet per year of fresh water from the waterways to feed both the CVP and the SWP. However, these pumps entrain significant amounts of fish, and these pumps have been the subject of a lawsuit.
Delta Levees
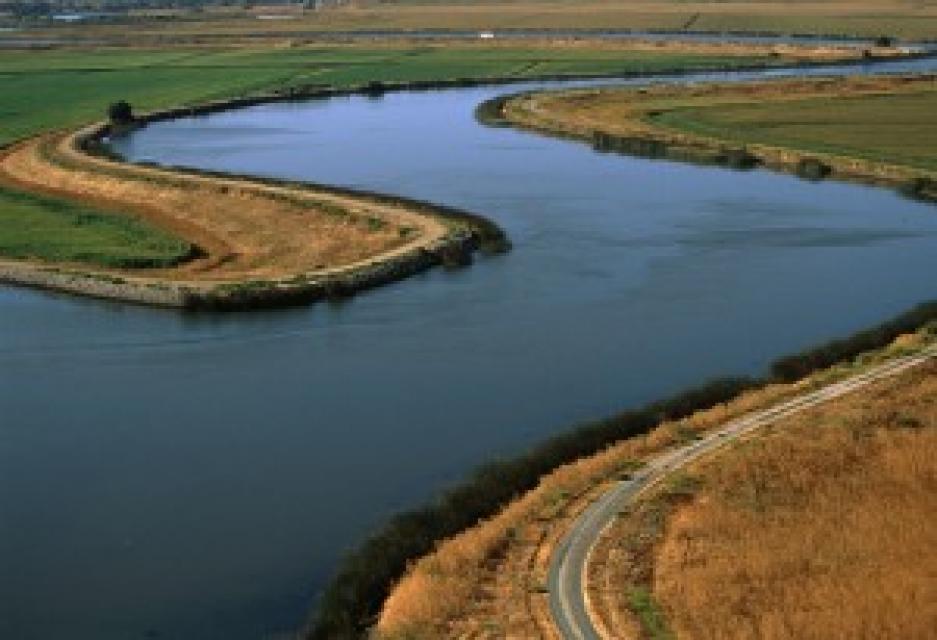 Besides being the hub of California’s water supply,
the Delta is a vital farming region with complex infrastructure
connecting the Bay Area to the Central Valley. More than 500,000
people live on farms and in 14 cities and towns in five counties.
Infrastructure includes five highways, three railroad lines, two
deep-water shipping channels, hundreds of natural gas lines and
five high-voltage transmission lines. The Delta also has more
than a half a million acres of productive farmland.
All of this property and infrastructure is protected by an extensive network of levees. In total, there are at least 1,100 miles of levees that protect the Delta and channel water through the area; many of these were built soon after the California Gold Rush. Since 1850, 95 percent of the estuary’s wetlands and tidal marshes have been leveed and filled, with resulting loss of fish and wildlife habitat. There is some concern that these older levees could fail.
Much of the network of levees through the Delta has been built only to 100-year flood standards; by contrast, the levees in New Orleans were built to 250-year standards when Hurricane Katrina hit. Levees are susceptible to failure by erosion, seepage, rising sea levels, earthquakes, and land subsidence. In California, levees have failed 162 times in the past 100 years.
If a critical levee failure occurred, salt water would flood many Delta islands, potentially disrupting water deliveries to Southern and Central California. Water users would be forced users to rely on stored supplies. It could take several years and billions of dollars for the water system to be restored if a major levee break occurred.
For more information on the Delta:
- California Delta Chambers and Visitor’s Bureau
- Department of Water Resources, Delta Initiatives
- The Bay Institute
The Controversy
Statewide water reliability depends on getting water south and west of the Delta to cities, farms and other uses.
For better than 20 years, the Delta has been embroiled in continued controversy about the struggle to restore the faltering ecosystem while maintaining its role as the hub of the state’s water supply.
Working Toward a Solution
 There are compounding issues to be addressed. A
five-year drought and limited water availability have had impacts
to how much water is released through the system (the SWP and
CVP). In addition, a court order regarding the decline of the
endangered Delta smelt has restricted how much water can be
pumped from the Delta.
The Delta Stewardship Council was formed in 2009 to develop a Delta Plan to be used to guide state and local actions in the Delta “in a manner that furthers the co-equal goals of Delta restoration and water supply reliability.
The council developed the Delta Plan, which aims to recover endangered species, reduce pollution, reduce invasive species, rebuild salmon runs, and enhance habitat for wildlife in six “high priority” locations in the Delta and Suisun Marsh.
Other recommendations include:
- improved water efficiency
- more storage
- development of other local water supplies
- protection of Delta farmlands and communities
- improved maintenance of Delta levees
California Water Fix
The WaterFix planning process began in 2006, initially proposed as the Bay Delta Conservation Plan (BDCP) – a permitting process for long-term project permits for the Delta.
The BDCP aimed to separate the water delivery system from Delta freshwater flows and restore thousands of acres of habitat, restore river flows to more natural patterns and address issues affecting the health of fish populations.
State and federal agencies proposed updating the SWP by adding new points of diversion in the north Delta. In July 2015, the California Department of Water Resources and Bureau of Reclamation identified WaterFix (Alternative 4A) as the preferred alternative, replacing the BDCP.
The $15 billion plan focused on the construction of two large, four-story tall tunnels to carry freshwater from the Sacramento River under the Delta toward the intake stations for the SWP and CVP. An additional $8 billion would be devoted to habitat restoration.
In 2019, California WaterFix was withdrawn. Currently, the Delta water conveyance plan is to construct a single tunnel that would re-route water around the Delta straight to the export pumps.
Read more at the California Department of Water Resources and the Delta Conveyance Authority.
The tunnel proposal has its supporters and critics.
Proponents say the tunnel would:
- Benefit fish: Taking water directly from the river 40 miles away from existing pumps, the tunnels would bypass the existing screens that fail to prevent fish from dying in the pumps
- Provide increased reliability: If levees fail during a natural disaster, the tunnels could still provide freshwater to the pumps and into the state and federal water delivery systems.
Opponents say the tunnel would:
- Harm fish: The endangered Delta smelt may benefit from the tunnels. But many biologists say the altered flows would doom the endangered Chinook salmon and steelhead that spawn in the Sacramento River. Improving the delta pumps’ 40-year-old fish screens instead would cost no more than $2 billion.
- Not provide increased reliability: there’s no way to safeguard the main aqueducts that transgress major fault lines that deliver water southward.
Read more at these websites:
Increased Flow Proposal
In September 2016, the California State Water Resources Control Board (State Water Board) released a revision of freshwater standards last updated since 1996.
Read about the Plan at the State Water Board website
The plan proposes to provide a minimum flow standard of 30 to 50 percent of the unimpaired natural runoff from the Stanislaus, Merced and Tuolumne rivers to be sent down the Lower San Joaquin River and into the Delta.
Again, there are viewpoints on both sides of the proposal.
- Pro: scientific studies have shown that flow is a major factor in the survival of fish such as salmon, steelhead, sturgeon and smelt
- Con: Result in a 14% reduction in surface water to the region, increase groundwater pumping by 105,000 acre-feet a year, and increase unmet agricultural water demand by at least 69,000 acre feet a year.
- Decrease the region’s economic output by $64 million.
A Question of Balance and Sustainability
Water is a limited resource; there is only so much of it to go around. Managing California’s finite water supply in the future so that it is sustainable and reliable will require striking a balance between the three stakeholders: urban users, agricultural users, and the environment. As the state continues to grow, it’s going to require rethinking in how we view and use water throughout the state, and we’re all going to have to be more efficient in how we use it.
* updated April 2021


